Results
Data from Chamorro-Premuzic et al. (2008). The authors investigated what kind of lecturers students like, based on the Big Five personality traits.
Correlation
| Variable | stu_neurotic | stu_extro | stu_open | stu_agree | stu_consc | lec_neurotic | lec_extro | lec_open | lec_agree | lec_consc | |||||||||||||
|---|---|---|---|---|---|---|---|---|---|---|---|---|---|---|---|---|---|---|---|---|---|---|---|
| 1. stu_neurotic | Pearson's r | — | |||||||||||||||||||||
| p-value | — | ||||||||||||||||||||||
| 2. stu_extro | Pearson's r | -0.336 | *** | — | |||||||||||||||||||
| p-value | < .001 | — | |||||||||||||||||||||
| 3. stu_open | Pearson's r | -0.055 | 0.069 | — | |||||||||||||||||||
| p-value | 0.259 | 0.160 | — | ||||||||||||||||||||
| 4. stu_agree | Pearson's r | 0.006 | 0.080 | -0.037 | — | ||||||||||||||||||
| p-value | 0.896 | 0.106 | 0.461 | — | |||||||||||||||||||
| 5. stu_consc | Pearson's r | -0.196 | *** | 0.186 | *** | -0.091 | 0.522 | *** | — | ||||||||||||||
| p-value | < .001 | < .001 | 0.066 | < .001 | — | ||||||||||||||||||
| 6. lec_neurotic | Pearson's r | 0.007 | -0.099 | * | -0.101 | * | -0.021 | -0.140 | ** | — | |||||||||||||
| p-value | 0.895 | 0.045 | 0.041 | 0.667 | 0.005 | — | |||||||||||||||||
| 7. lec_extro | Pearson's r | -0.081 | 0.153 | * | 0.041 | 0.050 | 0.102 | -0.002 | — | ||||||||||||||
| p-value | 0.176 | 0.010 | 0.499 | 0.412 | 0.090 | 0.975 | — | ||||||||||||||||
| 8. lec_open | Pearson's r | -0.018 | 0.068 | 0.201 | *** | 0.107 | * | 0.027 | 0.037 | 0.492 | *** | — | |||||||||||
| p-value | 0.712 | 0.165 | < .001 | 0.031 | 0.582 | 0.456 | < .001 | — | |||||||||||||||
| 9. lec_agree | Pearson's r | 0.101 | * | 0.004 | -0.163 | *** | 0.164 | *** | 0.133 | ** | 0.045 | 0.118 | * | 0.242 | *** | — | |||||||
| p-value | 0.041 | 0.932 | < .001 | < .001 | 0.007 | 0.361 | 0.049 | < .001 | — | ||||||||||||||
| 10. lec_consc | Pearson's r | 0.003 | -0.010 | -0.034 | 0.198 | *** | 0.216 | *** | -0.258 | *** | 0.101 | 0.120 | * | 0.240 | *** | — | |||||||
| p-value | 0.956 | 0.844 | 0.494 | < .001 | < .001 | < .001 | 0.093 | 0.014 | < .001 | — | |||||||||||||
| * p < .05, ** p < .01, *** p < .001 | |||||||||||||||||||||||
This looks pretty horrendous, but there are a lot of correlations that we don’t need. We’re interested only in the correlations between students’ personality and what they want in lecturers. We’re not interested in how their own five personality traits correlate with each other (i.e. if a student is neurotic are they conscientious too?).Thus, we can ignore quite a few of the correlations for the purpose of this study. If we round the values of interest to 2 decimal places they replicated the values reported in the original research paper (part of the authors’ table is below so you can see how they reported these values – match these values to the values in your output):
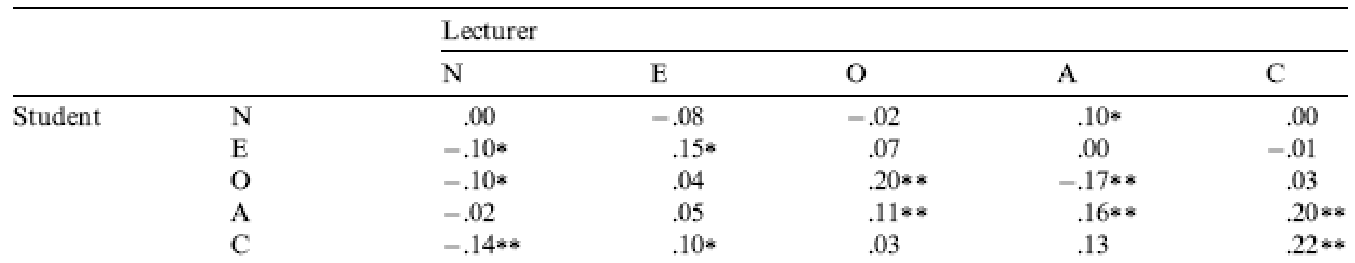
As for what we can conclude, neurotic students tend to want agreeable lecturers, r = .10, p = .041; extroverted students tend to want extroverted lecturers, r = .15, p = .010; students who are open to experience tend to want lecturers who are open to experience, r = .20, p < .001, and don’t want agreeable lecturers, r = −.16, p < .001; agreeable students want every sort of lecturer apart from neurotic. Finally, conscientious students tend to want conscientious lecturers, r = .22, p < .001, and extroverted ones, r = .10, p = .09 (note that the authors report the one-tailed p-value), but don’t want neurotic ones, r = −.14, p = .005. All of these correlations are quite weak, despite being significant.
Correlation - Pairwise Table
Another option to display that mess of a correlation table could be to use the "Display pairwise" option. Here is what that looks like:
| Pearson's r | p | ||||||||
|---|---|---|---|---|---|---|---|---|---|
| stu_neurotic | - | stu_extro | -0.336 | *** | < .001 | ||||
| stu_neurotic | - | stu_open | -0.055 | 0.259 | |||||
| stu_neurotic | - | stu_agree | 0.006 | 0.896 | |||||
| stu_neurotic | - | stu_consc | -0.196 | *** | < .001 | ||||
| stu_neurotic | - | lec_neurotic | 0.007 | 0.895 | |||||
| stu_neurotic | - | lec_extro | -0.081 | 0.176 | |||||
| stu_neurotic | - | lec_open | -0.018 | 0.712 | |||||
| stu_neurotic | - | lec_agree | 0.101 | * | 0.041 | ||||
| stu_neurotic | - | lec_consc | 0.003 | 0.956 | |||||
| stu_extro | - | stu_open | 0.069 | 0.160 | |||||
| stu_extro | - | stu_agree | 0.080 | 0.106 | |||||
| stu_extro | - | stu_consc | 0.186 | *** | < .001 | ||||
| stu_extro | - | lec_neurotic | -0.099 | * | 0.045 | ||||
| stu_extro | - | lec_extro | 0.153 | * | 0.010 | ||||
| stu_extro | - | lec_open | 0.068 | 0.165 | |||||
| stu_extro | - | lec_agree | 0.004 | 0.932 | |||||
| stu_extro | - | lec_consc | -0.010 | 0.844 | |||||
| stu_open | - | stu_agree | -0.037 | 0.461 | |||||
| stu_open | - | stu_consc | -0.091 | 0.066 | |||||
| stu_open | - | lec_neurotic | -0.101 | * | 0.041 | ||||
| stu_open | - | lec_extro | 0.041 | 0.499 | |||||
| stu_open | - | lec_open | 0.201 | *** | < .001 | ||||
| stu_open | - | lec_agree | -0.163 | *** | < .001 | ||||
| stu_open | - | lec_consc | -0.034 | 0.494 | |||||
| stu_agree | - | stu_consc | 0.522 | *** | < .001 | ||||
| stu_agree | - | lec_neurotic | -0.021 | 0.667 | |||||
| stu_agree | - | lec_extro | 0.050 | 0.412 | |||||
| stu_agree | - | lec_open | 0.107 | * | 0.031 | ||||
| stu_agree | - | lec_agree | 0.164 | *** | < .001 | ||||
| stu_agree | - | lec_consc | 0.198 | *** | < .001 | ||||
| stu_consc | - | lec_neurotic | -0.140 | ** | 0.005 | ||||
| stu_consc | - | lec_extro | 0.102 | 0.090 | |||||
| stu_consc | - | lec_open | 0.027 | 0.582 | |||||
| stu_consc | - | lec_agree | 0.133 | ** | 0.007 | ||||
| stu_consc | - | lec_consc | 0.216 | *** | < .001 | ||||
| lec_neurotic | - | lec_extro | -0.002 | 0.975 | |||||
| lec_neurotic | - | lec_open | 0.037 | 0.456 | |||||
| lec_neurotic | - | lec_agree | 0.045 | 0.361 | |||||
| lec_neurotic | - | lec_consc | -0.258 | *** | < .001 | ||||
| lec_extro | - | lec_open | 0.492 | *** | < .001 | ||||
| lec_extro | - | lec_agree | 0.118 | * | 0.049 | ||||
| lec_extro | - | lec_consc | 0.101 | 0.093 | |||||
| lec_open | - | lec_agree | 0.242 | *** | < .001 | ||||
| lec_open | - | lec_consc | 0.120 | * | 0.014 | ||||
| lec_agree | - | lec_consc | 0.240 | *** | < .001 | ||||
| * p < .05, ** p < .01, *** p < .001 | |||||||||