Results

Data from Chamorro-Premuzic et al. (2008). The authors investigated what kind of lecturers students like, based on the Big Five personality traits.

Lecturer neuroticism 

The first model we’ll fit predicts whether students want lecturers to be neurotic. Drag the outcome variable (lec_neurotic) to the box labelled Dependent Variable. Then, drag the variable age and all the student variables (e.g. stu_agree) to the box labelled Covariates, and the variable sex to the box labelled Factors. Then define the Model as follows. In Model 0, include age and sex, then in Model 1 add all five student variables.

Model Summary - lec_neurotic
Model R Adjusted R² RMSE R² Change F Change df1 df2 p
M₀ 0.167 0.028 0.023 8.774 0.028 5.300 2 370 0.005
M₁ 0.253 0.064 0.046 8.669 0.036 2.806 5 365 0.017
Note.  M₀ includes age, sex
Note.  M₁ includes age, sex, stu_neurotic, stu_extro, stu_open, stu_agree, stu_consc
ANOVA
Model   Sum of Squares df Mean Square F p
M₀ Regression 816.040 2 408.020 5.300 0.005
  Residual 28483.290 370 76.982  
  Total 29299.330 372  
M₁ Regression 1870.379 7 267.197 3.556 0.001
  Residual 27428.951 365 75.148  
  Total 29299.330 372  
Note.  M₀ includes age, sex
Note.  M₁ includes age, sex, stu_neurotic, stu_extro, stu_open, stu_agree, stu_consc
Coefficients
95% CI
Collinearity Statistics
Model   Unstandardized Standard Error Standardizedᵃ t p Lower Upper Tolerance VIF
M₀ (Intercept) -28.220 2.586 -10.913 < .001 -33.305 -23.135  
  age 0.278 0.129 0.110 2.151 0.032 0.024 0.533 0.999 1.001
  sex (Male) 2.419 1.023 2.364 0.019 0.407 4.430 0.999 1.001
M₁ (Intercept) -16.774 5.296 -3.167 0.002 -27.189 -6.359  
  age 0.301 0.128 0.119 2.353 0.019 0.049 0.553 0.995 1.005
  sex (Male) 1.903 1.085 1.754 0.080 -0.230 4.037 0.867 1.153
  stu_neurotic -0.060 0.059 -0.059 -1.022 0.307 -0.176 0.056 0.762 1.313
  stu_extro -0.107 0.075 -0.078 -1.428 0.154 -0.256 0.041 0.853 1.172
  stu_open -0.174 0.073 -0.123 -2.391 0.017 -0.318 -0.031 0.974 1.027
  stu_agree 0.087 0.072 0.073 1.218 0.224 -0.054 0.228 0.719 1.391
  stu_consc -0.203 0.082 -0.157 -2.482 0.013 -0.363 -0.042 0.645 1.550
ᵃ Standardized coefficients can only be computed for continuous predictors.
Influential Cases
Case Number Std. Residual lec_neurotic Predicted Value Residual Cook's Distance
14 3.237 0.000 -26.738 26.738 0.133
34 3.181 0.000 -26.175 26.175 0.139
277 4.451 22.000 -14.477 36.477 0.294
282 3.181 10.000 -17.246 27.246 0.030
414 3.609 8.000 -23.208 31.208 0.008
419 5.133 25.000 -18.985 43.985 0.077
422 5.481 25.000 -21.525 46.525 0.161
425 3.706 13.000 -18.931 31.931 0.021

Residuals vs. Predicted

Standardized Residuals Histogram

Q-Q Plot Standardized Residuals

So basically, age, openness and conscientiousness were significant predictors of wanting a neurotic lecturer (note that for openness and conscientiousness the relationship is negative, i.e. the more a student scored on these characteristics, the less they wanted a neurotic lecturer). However, a look at the Q-Q plot and the residual vs. predicted plots do give some reason to worry about possible violatios of the normality and heteroscedasticity assumptions and so should be interpreted with caution

Lecturer Extroversion

The second variable we want to predict is lecturer extroversion. You can follow the steps of the first example but drag the outcome variable lec_neurotic out of the box labelled Dependent variable and in its place drag lec_extro.

Model Summary - lec_extro
Model R Adjusted R² RMSE R² Change F Change df1 df2 p
M₀ 0.076 0.006 -0.002 6.877 0.006 0.786 2 269 0.457
M₁ 0.215 0.046 0.021 6.799 0.040 2.238 5 264 0.051
Note.  M₀ includes age, sex
Note.  M₁ includes age, stu_neurotic, stu_extro, stu_open, stu_agree, stu_consc, sex
ANOVA
Model   Sum of Squares df Mean Square F p
M₀ Regression 74.360 2 37.180 0.786 0.457
  Residual 12721.607 269 47.292  
  Total 12795.967 271  
M₁ Regression 591.748 7 84.535 1.829 0.082
  Residual 12204.219 264 46.228  
  Total 12795.967 271  
Note.  M₀ includes age, sex
Note.  M₁ includes age, stu_neurotic, stu_extro, stu_open, stu_agree, stu_consc, sex
Coefficients
95% CI
Collinearity Statistics
Model   Unstandardized Standard Error Standardizedᵃ t p Lower Upper Tolerance VIF
M₀ (Intercept) 11.823 2.277 5.192 < .001 7.340 16.306  
  age 0.036 0.110 0.020 0.329 0.742 -0.181 0.254 0.998 1.002
  sex (Male) 1.120 0.938 1.194 0.234 -0.727 2.966 0.998 1.002
M₁ (Intercept) 2.033 4.774 0.426 0.670 -7.366 11.433  
  age 0.005 0.110 0.003 0.050 0.960 -0.211 0.222 0.986 1.015
  stu_neurotic 0.017 0.057 0.022 0.305 0.761 -0.095 0.130 0.701 1.427
  stu_extro 0.160 0.068 0.155 2.338 0.020 0.025 0.294 0.820 1.220
  stu_open 0.045 0.068 0.041 0.664 0.507 -0.089 0.180 0.966 1.036
  stu_agree 0.013 0.064 0.014 0.202 0.840 -0.114 0.140 0.707 1.415
  stu_consc 0.110 0.076 0.112 1.461 0.145 -0.038 0.259 0.617 1.620
  sex (Male) 1.581 1.012 1.562 0.119 -0.411 3.573 0.838 1.193
ᵃ Standardized coefficients can only be computed for continuous predictors.

You should find that student extroversion was the only significant predictor of wanting an extrovert lecturer; the model overall did not explain a significant amount of the variance in wanting an extroverted lecturer.

Lecturer Openness to Experience

You can follow the steps of the first example but drag the outcome variable lec_open into the box labelled Dependent Variable.

Model Summary - lec_open
Model R Adjusted R² RMSE R² Change F Change df1 df2 p
M₀ 0.015 0.000 -0.005 8.132 0.000 0.044 2 372 0.957
M₁ 0.254 0.064 0.046 7.921 0.064 5.027 5 367 < .001
Note.  M₀ includes age, sex
Note.  M₁ includes age, stu_neurotic, stu_extro, stu_open, stu_agree, stu_consc, sex
ANOVA
Model   Sum of Squares df Mean Square F p
M₀ Regression 5.843 2 2.922 0.044 0.957
  Residual 24602.546 372 66.136  
  Total 24608.389 374  
M₁ Regression 1582.788 7 226.113 3.604 < .001
  Residual 23025.601 367 62.740  
  Total 24608.389 374  
Note.  M₀ includes age, sex
Note.  M₁ includes age, stu_neurotic, stu_extro, stu_open, stu_agree, stu_consc, sex
Coefficients
95% CI
Collinearity Statistics
Model   Unstandardized Standard Error Standardizedᵃ t p Lower Upper Tolerance VIF
M₀ (Intercept) 9.352 2.372 3.942 < .001 4.687 14.017  
  age -0.033 0.118 -0.014 -0.276 0.782 -0.266 0.200 0.999 1.001
  sex (Male) 0.113 0.944 0.119 0.905 -1.744 1.970 0.999 1.001
M₁ (Intercept) -5.512 4.830 -1.141 0.255 -15.010 3.986  
  age -0.043 0.116 -0.019 -0.370 0.712 -0.270 0.184 0.996 1.004
  stu_neurotic 0.006 0.054 0.007 0.115 0.908 -0.099 0.112 0.757 1.321
  stu_extro 0.065 0.069 0.052 0.945 0.345 -0.071 0.201 0.847 1.180
  stu_open 0.281 0.066 0.217 4.238 < .001 0.150 0.411 0.970 1.031
  stu_agree 0.146 0.065 0.133 2.232 0.026 0.017 0.274 0.721 1.387
  stu_consc -0.060 0.074 -0.051 -0.813 0.417 -0.207 0.086 0.644 1.552
  sex (Male) -0.220 0.990 -0.222 0.824 -2.168 1.728 0.861 1.161
ᵃ Standardized coefficients can only be computed for continuous predictors.

You should find that student openness to experience was the most significant predictor of wanting a lecturer who is open to experience, but student agreeableness significantly predicted this also.

Lecturer Agreeableness

The fourth variable we want to predict is lecturer agreeableness. You can follow the steps of the first example but drag lec_agree into the box labelled Dependent Variable.

Model Summary - lec_agree
Model R Adjusted R² RMSE R² Change F Change df1 df2 p
M₀ 0.178 0.032 0.026 9.471 0.032 6.043 2 369 0.003
M₁ 0.320 0.103 0.085 9.180 0.071 5.752 5 364 < .001
Note.  M₀ includes age, sex
Note.  M₁ includes age, stu_neurotic, stu_extro, stu_open, stu_agree, stu_consc, sex
ANOVA
Model   Sum of Squares df Mean Square F p
M₀ Regression 1084.187 2 542.094 6.043 0.003
  Residual 33098.931 369 89.699  
  Total 34183.118 371  
M₁ Regression 3507.788 7 501.113 5.946 < .001
  Residual 30675.330 364 84.273  
  Total 34183.118 371  
Note.  M₀ includes age, sex
Note.  M₁ includes age, stu_neurotic, stu_extro, stu_open, stu_agree, stu_consc, sex
Coefficients
95% CI
Collinearity Statistics
Model   Unstandardized Standard Error Standardizedᵃ t p Lower Upper Tolerance VIF
M₀ (Intercept) 18.191 2.788 6.524 < .001 12.708 23.674  
  age -0.471 0.140 -0.173 -3.376 < .001 -0.746 -0.197 0.998 1.002
  sex (Male) -0.758 1.109 -0.684 0.494 -2.938 1.422 0.998 1.002
M₁ (Intercept) 7.037 5.612 1.254 0.211 -3.999 18.072  
  age -0.477 0.135 -0.175 -3.520 < .001 -0.743 -0.210 0.995 1.005
  stu_neurotic 0.171 0.062 0.156 2.742 0.006 0.048 0.293 0.761 1.314
  stu_extro 0.064 0.080 0.043 0.805 0.421 -0.093 0.221 0.851 1.175
  stu_open -0.215 0.077 -0.141 -2.790 0.006 -0.366 -0.063 0.971 1.029
  stu_agree 0.172 0.076 0.132 2.255 0.025 0.022 0.323 0.715 1.398
  stu_consc 0.100 0.086 0.072 1.161 0.246 -0.070 0.270 0.638 1.568
  sex (Male) 1.002 1.154 0.869 0.386 -1.267 3.272 0.865 1.156
ᵃ Standardized coefficients can only be computed for continuous predictors.

You should find that age, student openness to experience and student neuroticism significantly predicted wanting a lecturer who is agreeable. Age and openness to experience had negative relationships (the older and more open to experienced you are, the less you want an agreeable lecturer), whereas as student neuroticism increases so does the desire for an agreeable lecturer (not surprisingly, because neurotics will lack confidence and probably feel more able to ask an agreeable lecturer questions).

Lecturer Conscientiousness

The final variable we want to predict is lecturer conscientiousness. You can follow the steps of the first example but drag lec_consc into the box labelled Dependent Variable.

Model Summary - lec_consc
Model R Adjusted R² RMSE R² Change F Change df1 df2 p
M₀ 0.144 0.021 0.015 7.413 0.021 3.892 2 369 0.021
M₁ 0.271 0.074 0.056 7.259 0.053 4.162 5 364 0.001
Note.  M₀ includes age, sex
Note.  M₁ includes age, stu_neurotic, stu_extro, stu_open, stu_agree, stu_consc, sex
ANOVA
Model   Sum of Squares df Mean Square F p
M₀ Regression 427.742 2 213.871 3.892 0.021
  Residual 20276.524 369 54.950  
  Total 20704.266 371  
M₁ Regression 1524.216 7 217.745 4.132 < .001
  Residual 19180.050 364 52.692  
  Total 20704.266 371  
Note.  M₀ includes age, sex
Note.  M₁ includes age, stu_neurotic, stu_extro, stu_open, stu_agree, stu_consc, sex
Coefficients
95% CI
Collinearity Statistics
Model   Unstandardized Standard Error Standardizedᵃ t p Lower Upper Tolerance VIF
M₀ (Intercept) 14.967 2.183 6.855 < .001 10.674 19.261  
  age 0.117 0.109 0.055 1.070 0.285 -0.098 0.332 0.998 1.002
  sex (Male) -2.276 0.868 -2.622 0.009 -3.982 -0.569 0.998 1.002
M₁ (Intercept) 6.357 4.433 1.434 0.152 -2.360 15.073  
  age 0.097 0.107 0.046 0.901 0.368 -0.114 0.307 0.994 1.006
  stu_neurotic 0.010 0.049 0.012 0.212 0.832 -0.086 0.107 0.764 1.309
  stu_extro -0.069 0.064 -0.059 -1.076 0.283 -0.194 0.057 0.851 1.176
  stu_open -0.011 0.061 -0.009 -0.179 0.858 -0.131 0.109 0.969 1.032
  stu_agree 0.146 0.060 0.144 2.436 0.015 0.028 0.263 0.727 1.376
  stu_consc 0.138 0.068 0.127 2.018 0.044 0.004 0.273 0.643 1.556
  sex (Male) -1.560 0.914 -1.706 0.089 -3.359 0.238 0.862 1.160
ᵃ Standardized coefficients can only be computed for continuous predictors.
Influential Cases
Case Number Std. Residual lec_consc Predicted Value Residual Cook's Distance
188 -3.055 -8.000 13.890 -21.890 0.031
253 -3.116 -4.000 18.415 -22.415 0.022
417 -3.022 -7.000 14.814 -21.814 0.013

Student agreeableness and conscientiousness both signfiicantly predict wanting a lecturer who is conscientious. Note also that gender predicted this in the first step, but its b^ became slightly non-significant (p = .07) when the student personality variables were forced in as well. However, sex is probably a variable that should be explored further within this context.


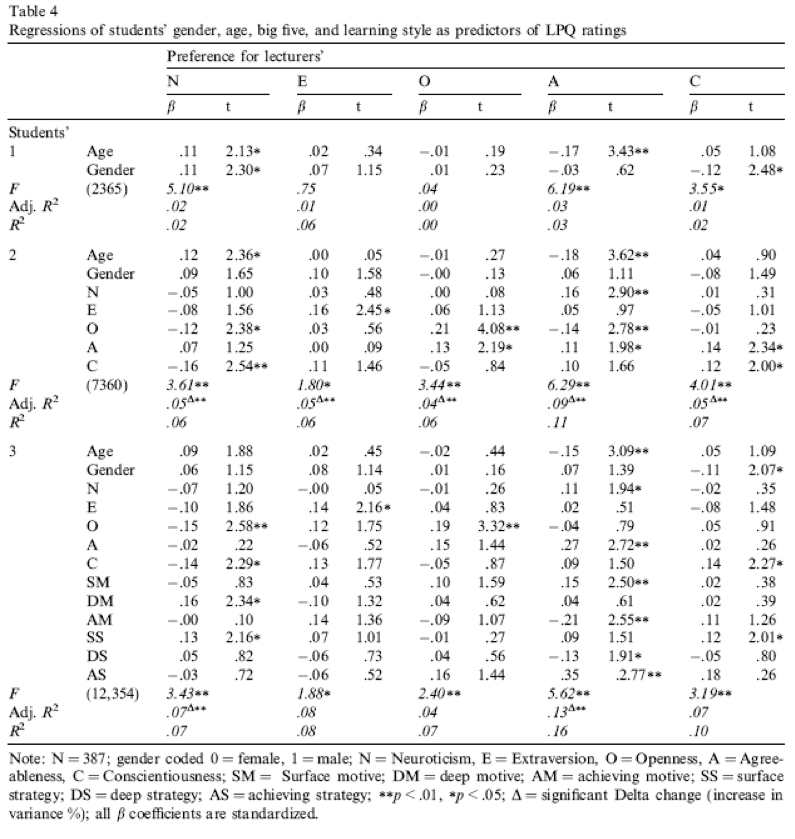
Compare all of your results to Table 4 in the actual article (shown below) - our five analyses are represented by the columns labelled N, E, O, A and C).